6. OSA-Web: Fleet Monitoring Dashboard
6.1. Overview
The OSA-Web dashboard is a comprehensive Django-based application designed for multi-camera fleet monitoring. It utilizes real-time WebSocket frame streaming and a Celery task queue to perform AI-powered shelf analysis asynchronously, allowing centralized management of entire retail spaces.
6.2. Features
Multi-Camera Management: Easily configure and monitor numerous RTSP streams simultaneously.
Real-time WebSockets: Streams annotated frames and live analytics directly to the browser with ultra-low latency.
Distributed Processing: Utilizes Redis and Celery to execute heavy computer-vision pipelines asynchronously.
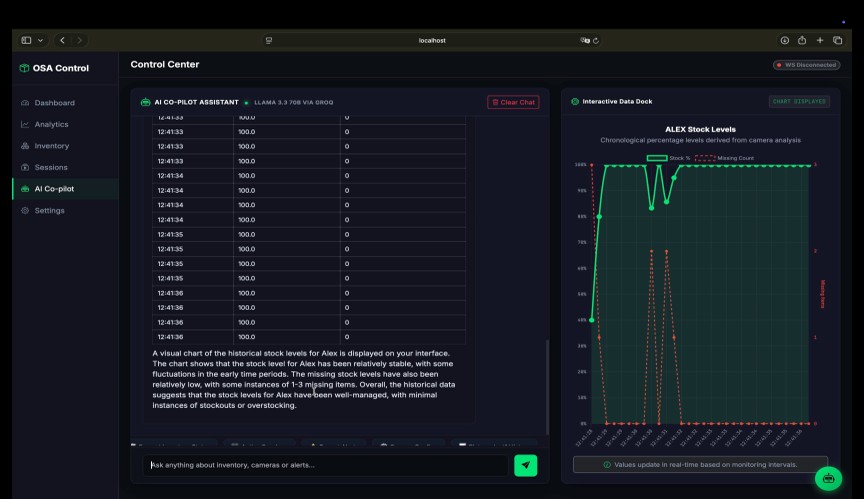
AI Assistant Co-Pilot: Integrated intelligent assistant capable of understanding natural language queries and generating dynamic charts based on inventory data.
6.3. User Interface
6.3.1. Home Dashboard
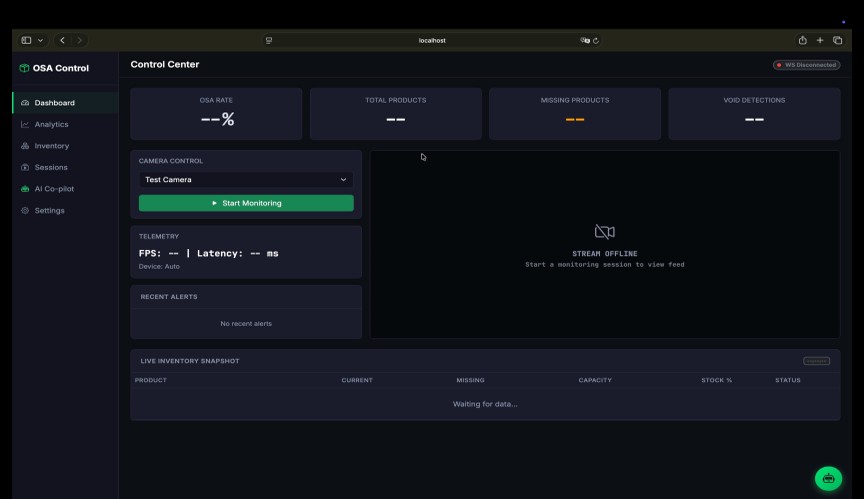
The Web Dashboard Home provides a centralized view of all active monitoring sessions, fleet-wide alerts, and top-level KPIs.
6.3.2. Real-Time Monitoring
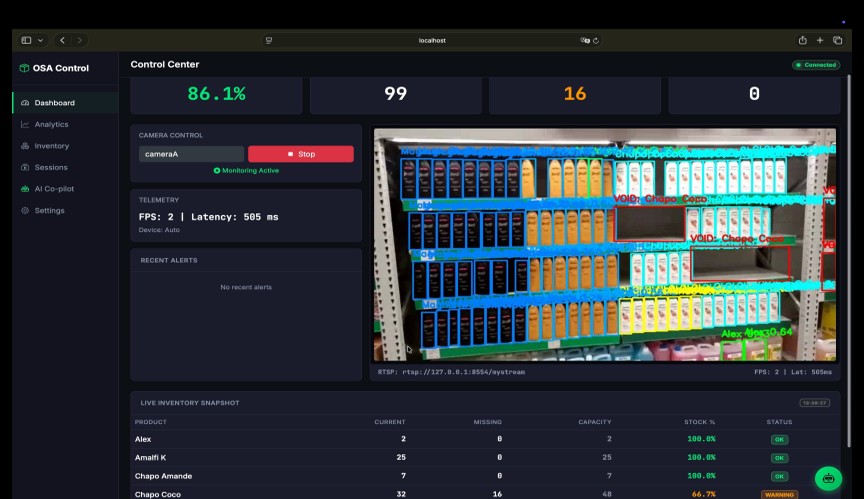
Watch a live, annotated feed of any active camera session with associated real-time metrics streaming alongside the video.
6.3.3. Configuration
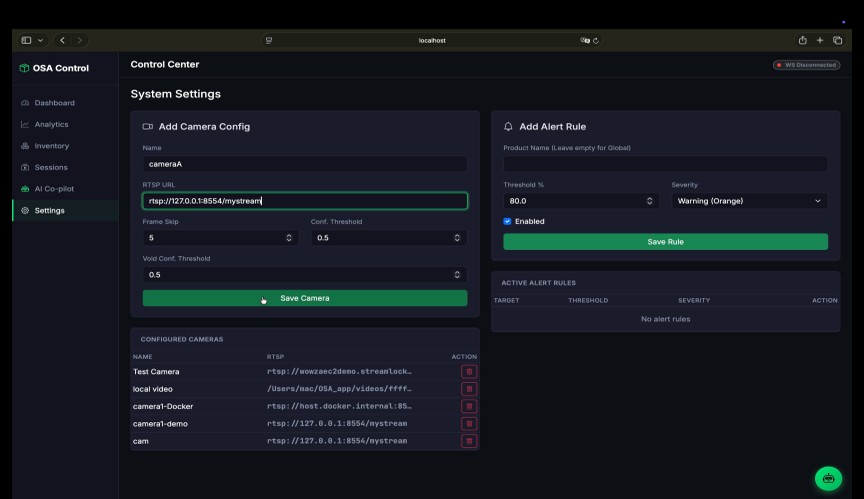
Administrators can easily configure camera endpoints, model paths, and alert rules through the management interface.
6.4. Session Management
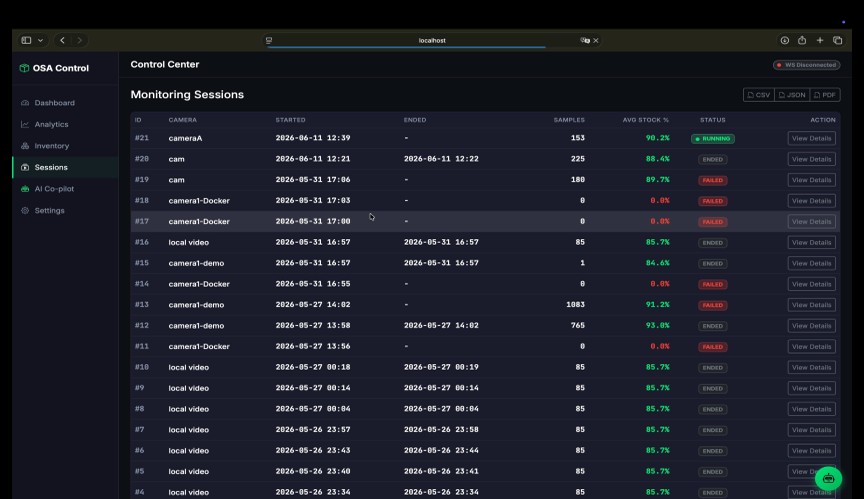
6.4.1. Sessions History
Browse past monitoring sessions, review performance data, and access historical analytics.
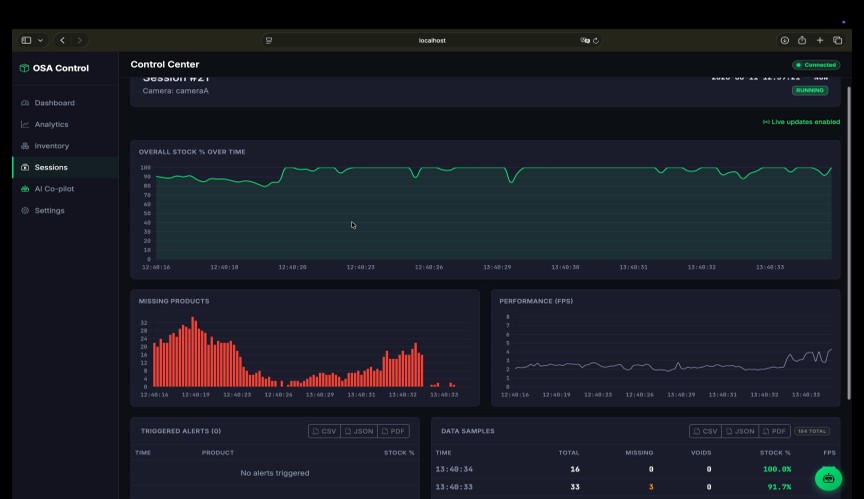
6.4.2. Session Details
Examine a specific session in depth, exploring the timeline of events, threshold triggers, and overall performance during that period.
6.5. Analytics & Reporting
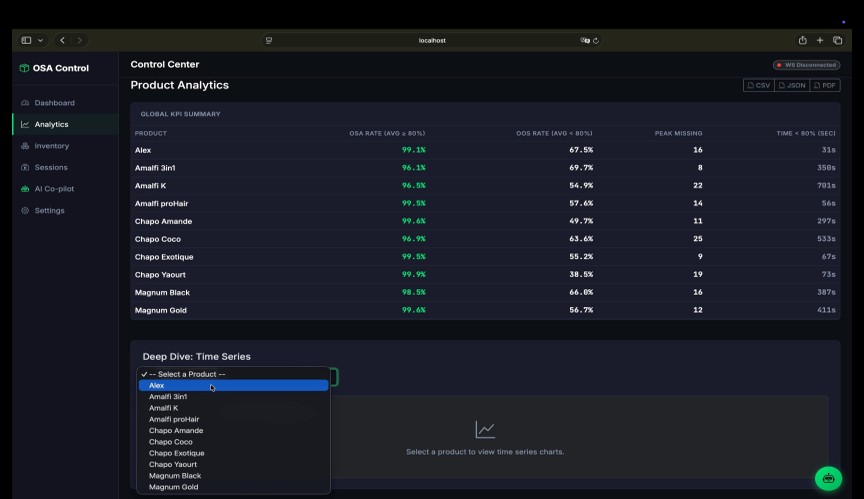
6.5.1. KPIs Dashboard
Track aggregated Key Performance Indicators across the entire store or drill down into specific camera zones.
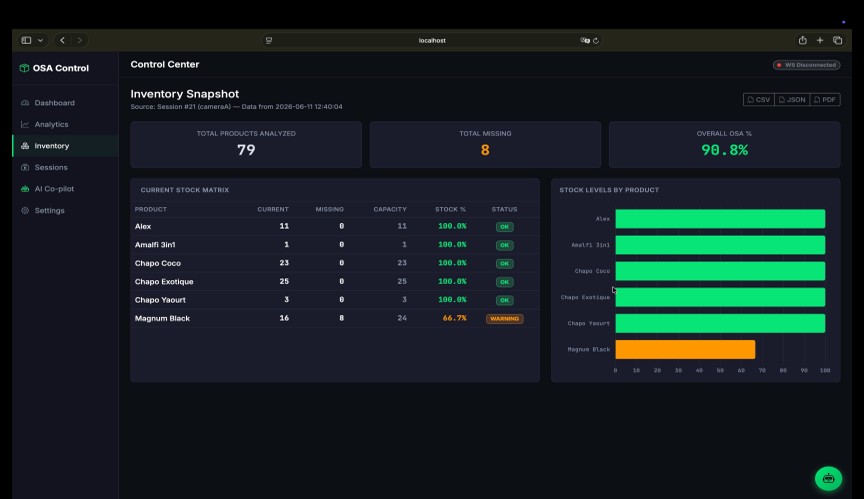
6.5.2. Stock Inventory
View current stock levels, missing items, and capacity data for all monitored product categories.
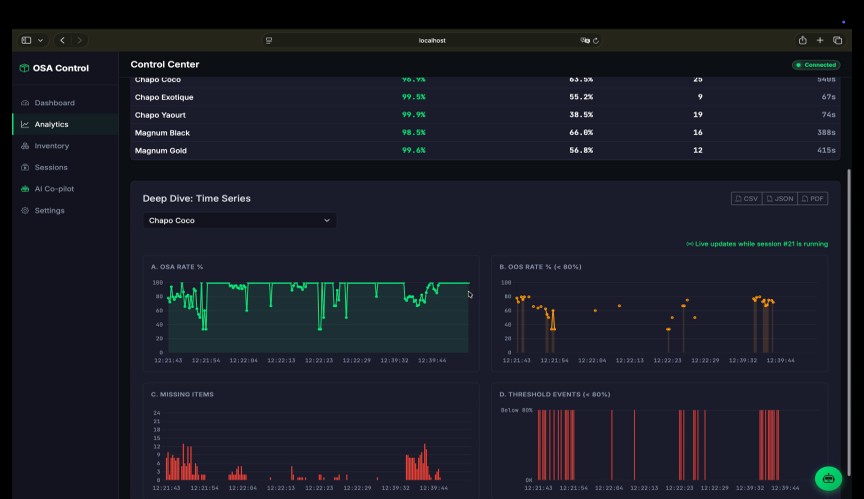
6.5.3. Temporal Analysis
Analyze stock fluctuations and restock cycles over time using interactive temporal charts.
6.6. AI Assistant Co-Pilot
The OSA-Web dashboard includes a powerful Groq-powered AI Assistant.
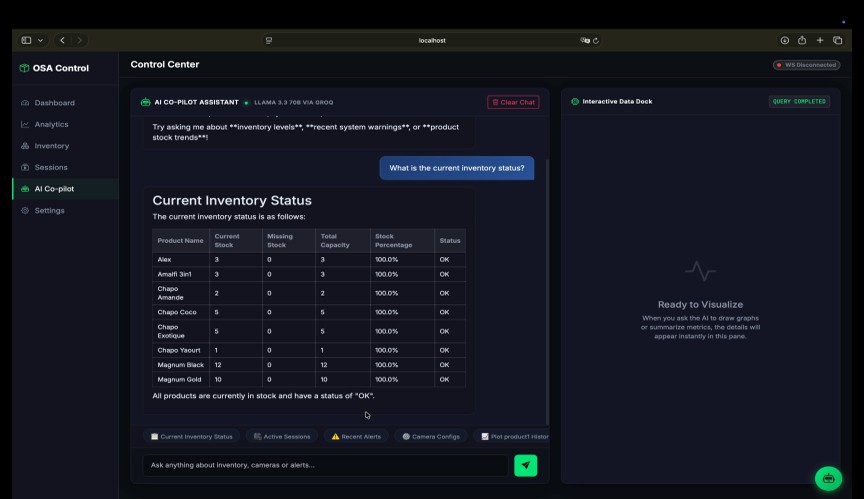
6.6.1. Interactive Queries
Ask natural language questions about your inventory data (e.g., « Which products are critically low? », « Show me the restocking trends for Cola »).
6.6.2. Dynamic Graph Generation
The AI Assistant can generate dynamic, interactive graphs directly in the chat interface in response to complex analytical questions.