5. OSA-Desktop: Industrial Control Centre
5.1. Overview
The OSA-Desktop application is a powerful PyQt6-based industrial control centre designed for single-operator, live RTSP monitoring. It serves as the local interface for the On-Shelf Availability (OSA) system, allowing real-time AI-powered shelf analysis directly from a camera feed without the need for a web server.
5.2. Features
Live RTSP Stream Analysis: Connects directly to continuous CCTV streams without the overhead of static media processing.
Hardware Accelerated AI Pipeline: Utilizes YOLO for product/void detection and CNN for SKU classification, optimized for the best available hardware accelerator.
Modern UI: Features Docker Light and OSA Dark themes, interactive bounding boxes, and comprehensive HUD overlays.
Robust Alert System: Provides threshold-based notifications, warning/critical states, and recovery detection directly to the user.
5.3. User Interface
5.3.1. Home Dashboard
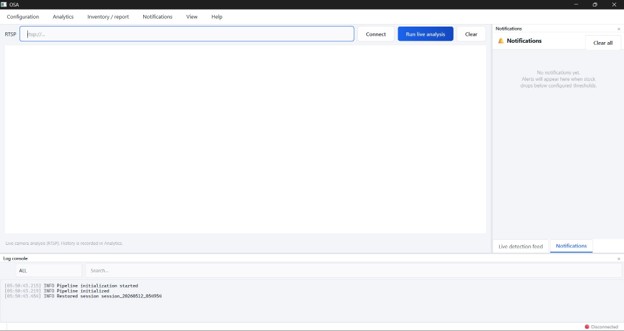
The Home dashboard provides an immediate overview of the system’s operational status and live metrics.
5.3.2. Real-Time Detection
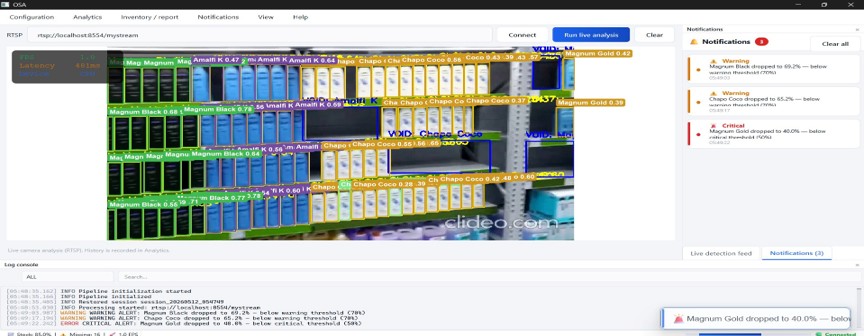
Connect to a live RTSP feed and watch the AI pipeline in action. The interface overlays bounding boxes for detected products, voids, and classification confidences.
5.3.3. Configuration
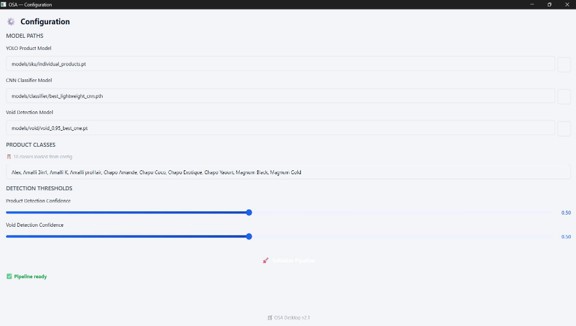
Configure the pipeline easily using the settings panel. Users can adjust confidence thresholds, select models, and fine-tune alerting behaviors.
5.4. Analytics & Reporting
5.4.1. KPIs Overview
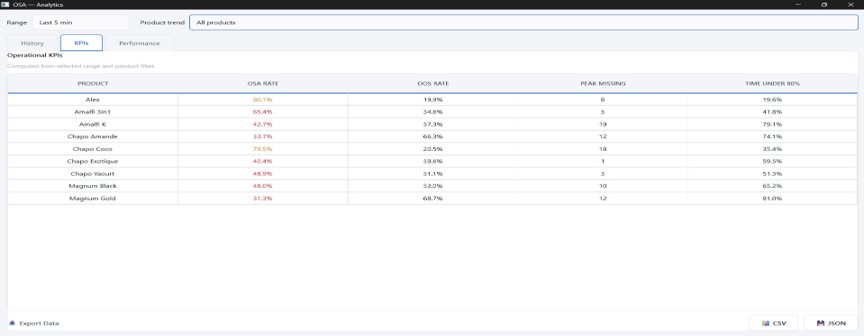
The KPI dashboard translates raw detections into actionable industry-standard metrics, including OSA Rate, Out-Of-Stock (OOS) Rate, and Peak Missing items.
5.4.2. Stock Inventory
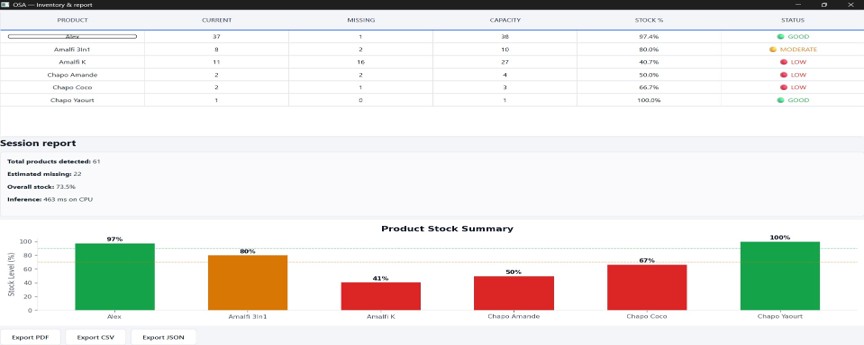
View the live stock table detailing exact capacities, missing items, and current stock percentages for every product category.
5.4.3. KPI Evolution per Product
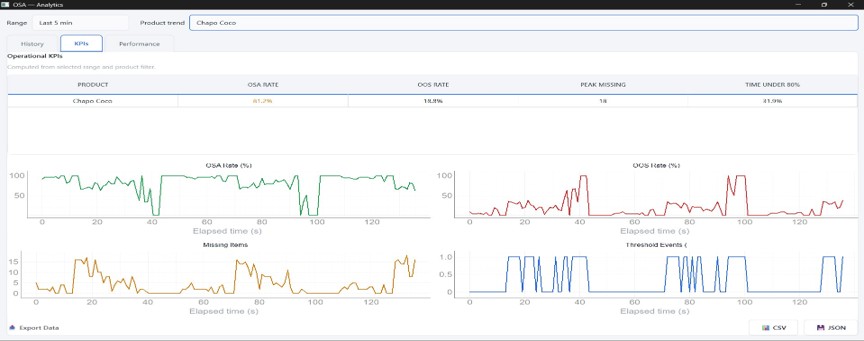
Deep dive into the temporal evolution of specific products with dynamic 2x2 grid charts, mapping availability trends over the active session.
5.4.4. Comprehensive Analytics
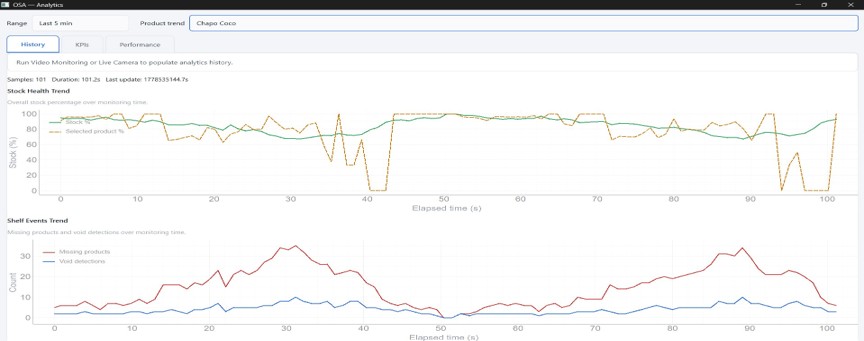
A broader look at all collected analytics data, enabling comprehensive reporting and export to CSV, JSON, or PDF formats.
5.4.5. System Performance
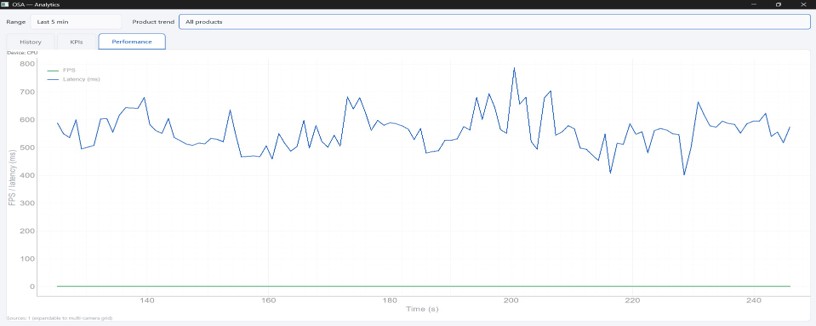
Monitor the hardware usage, AI pipeline latency (ms), and frame processing rate (FPS) in real-time.