3. Dual YOLO Detection and Spatial Analysis System
3.1. Overview
The Dual YOLO Detection system combines product detection and void space analysis with advanced spatial intelligence to provide comprehensive shelf monitoring and inventory management. This system leverages deep learning models for simultaneous detection of products and empty spaces, followed by sophisticated spatial analysis algorithms.
3.2. Processing Pipeline
The system follows a multi-stage pipeline for comprehensive spatial analysis:
Input Image
     ↓
┌──────────────────────────────────────────────┐
│            YOLO Detection                    │
│  ┌──────────────────┐  ┌───────────────────┐ │
│  │ Product Detection│  │  Void Detection   │ │
│  │ - individual_    │  │  - void_model.pt  │ │
│  │   products.pt    │  │  - Confidence: 50%│ │
│  │ - Confidence: 50%│  │  - Geographic     │ │
│  │ - Bounding boxes │  │    localization   │ │
│  │ - Spatial coords │  │  - Size & shape   │ │
│  └──────────────────┘  └───────────────────┘ │
└──────────────────────────────────────────────┘
     ↓
┌─────────────────────────────────────────────┐
│          CNN Classification                 │
│  - Input: 224x224x3 RGB crops               │
│  - Architecture: 4 conv blocks              │
│  - Real-time sub-category classification    │
│  - Confidence scores per class              │
└─────────────────────────────────────────────┘
     ↓
┌──────────────────────────────────────────────┐
│       Spatial Context Analysis               │
│  ┌─────────────────────────────────────────┐ │
│  │ Level 1: Strong Spatial Context         │ │
│  │ - Confidence: 0.9-1.0                   │ │
│  │ - Direct neighborhood analysis          │ │
│  └─────────────────────────────────────────┘ │
│  ┌─────────────────────────────────────────┐ │
│  │ Level 2: Moderate Spatial Context       │ │
│  │ - Confidence: 0.6                       │ │
│  │ - Extended neighborhood search          │ │
│  └─────────────────────────────────────────┘ │
│  ┌─────────────────────────────────────────┐ │
│  │ Level 3: Multi-factor Scoring           │ │
│  │ - Variable confidence                   │ │
│  │ - Complex spatial relationships         │ │
│  └─────────────────────────────────────────┘ │
└──────────────────────────────────────────────┘
     ↓
┌─────────────────────────────────────────────┐
│         Spatial Clustering                  │
│  - DBSCAN Algorithm (EPS: 80px)             │
│  - Minimum cluster size: 2 products         │
│  - Center extraction & analysis             │
└─────────────────────────────────────────────┘
     ↓
┌─────────────────────────────────────────────┐
│         Pattern Analysis                    │
│  - Horizontal/Vertical pattern detection    │
│  - Spatial arrangement classification       │
│  - Dominant pattern identification          │
└─────────────────────────────────────────────┘
     ↓
┌─────────────────────────────────────────────┐
│         Void Attribution                    │
│  - Pattern detection & cluster formation    │
│  - Multi-factor scoring system              │
│  - Intelligent void assignment              │
└─────────────────────────────────────────────┘
     ↓
┌─────────────────────────────────────────────┐
│      Inventory Estimation                   │
│  - Direct counting + void-based estimation  │
│  - Volumetric analysis                      │
│  - Stock metrics calculation                │
└─────────────────────────────────────────────┘
     ↓
Final Results & Analytics
3.3. System Architecture
3.3.1. Dual YOLO Detection Module
The system employs two specialized YOLO models operating in parallel:
- Product Detection Model
Model:
individual_products.ptConfidence threshold: 50%
Outputs: Bounding boxes, spatial coordinates (x, y, w, h), individual confidence scores
- Void Detection Model
Model:
void_model.ptConfidence threshold: 50%
Capabilities: Empty space identification, precise geographic localization, size and shape analysis
3.3.2. CNN Classification System
Following YOLO detection, a lightweight CNN architecture performs fine-grained product classification:
- Architecture Specifications:
Input dimensions: 224×224×3 RGB
4 convolutional blocks with progressive filter scaling (32→64→128→256)
BatchNorm + ReLU + MaxPooling per block
GlobalAveragePooling2D + Dense layers for classification
Real-time sub-category classification with confidence scoring
CNN Classification on YOLO Cropped Images:
The CNN classifier processes individual product crops extracted by YOLO detection, providing fine-grained sub-category classification with confidence scores for each detected product.
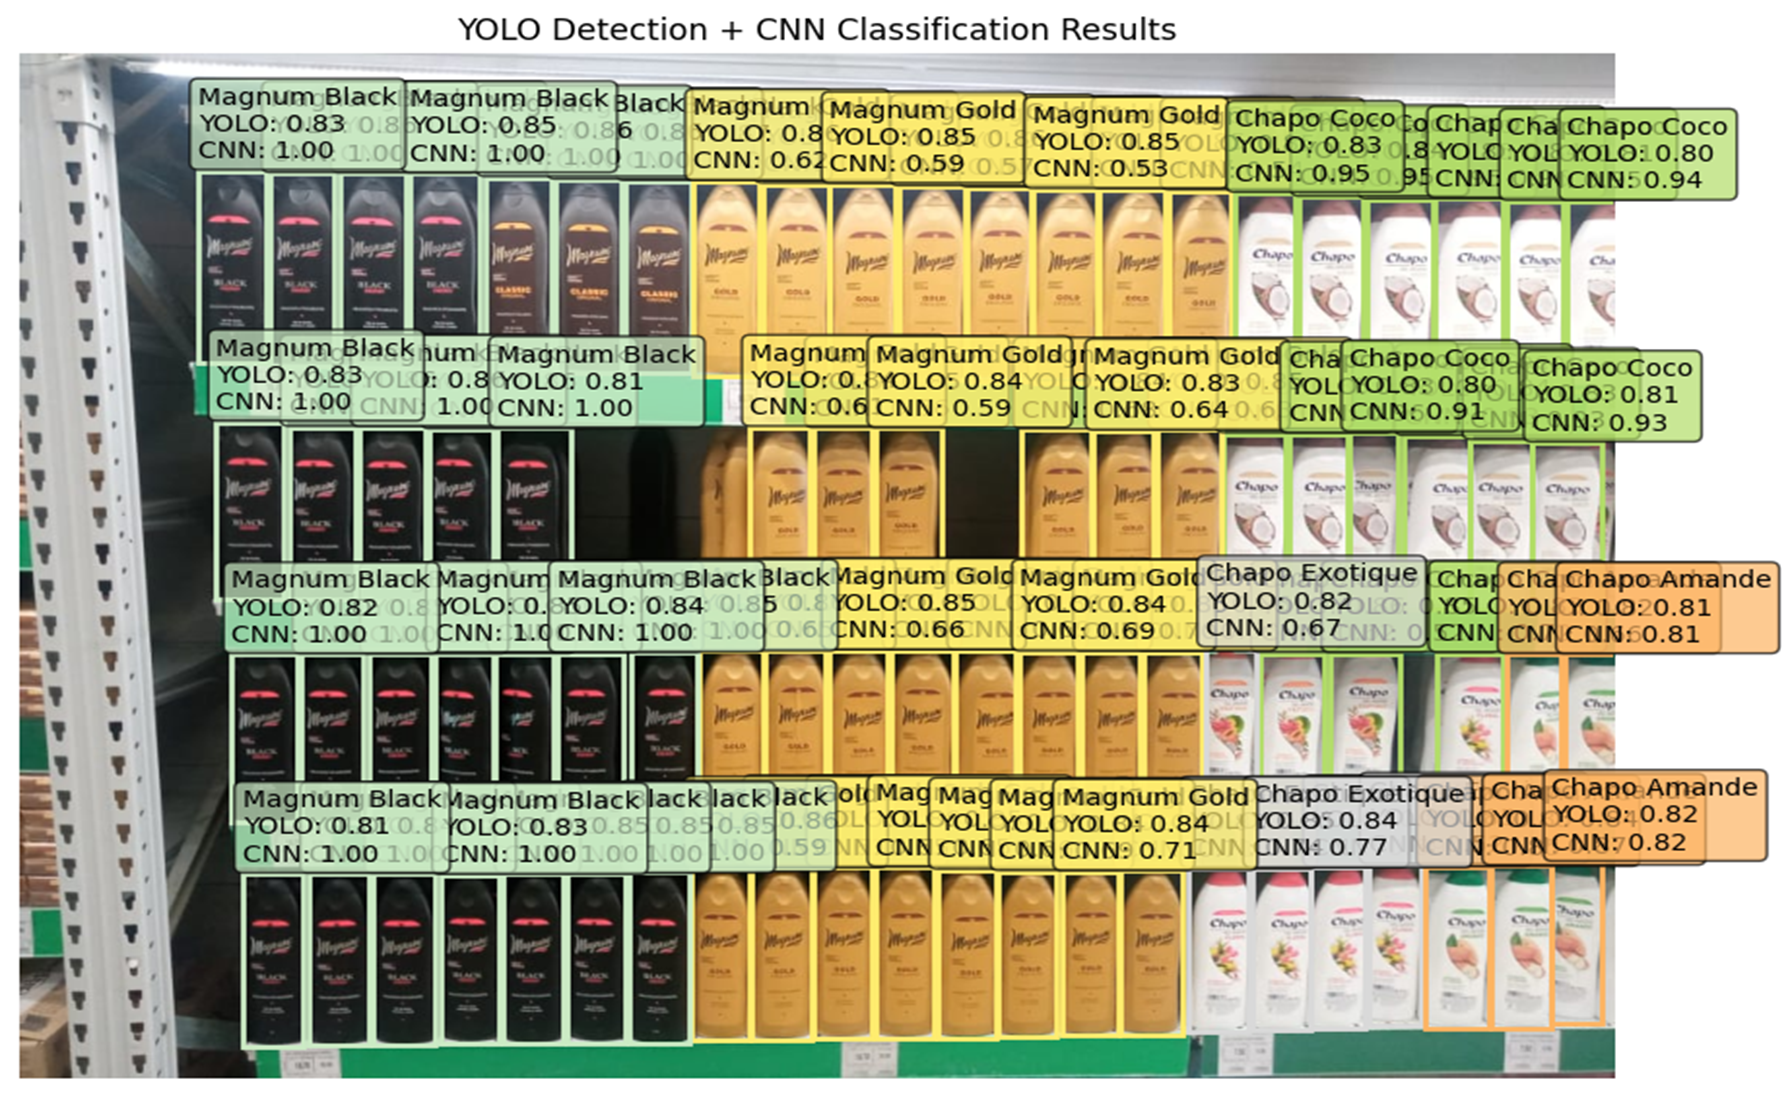
Figure: Example of CNN classification applied to YOLO-detected product crops, showing product names with YOLO and CNN confidence scores
3.4. Spatial Context Analysis
The system implements a three-tier spatial intelligence framework:
3.4.1. Level 1: Strong Spatial Context
Confidence Range: 0.9-1.0
Detection Rules: Same product on left AND right sides
Example Context Types: - Horizontal Strong Context: Coca-Cola → VOID → Coca-Cola - Vertical Strong Context: Pepsi → VOID → Pepsi
3.4.2. Level 2: Moderate Spatial Context
Confidence Range: 0.6
Detection Rules: Same product on ONE side only
Search Pattern: Extended neighborhood analysis
3.4.3. Level 3: Multi-factor Scoring
Confidence Range: Variable
Methodology: Complex spatial relationship analysis
Factors: Proximity, product clustering, shelf organization patterns
3.5. Spatial Clustering Algorithm
3.5.1. DBSCAN Implementation
The system utilizes DBSCAN (Density-Based Spatial Clustering) for intelligent product grouping:
- Parameters:
EPS (Epsilon): 80 pixels
Minimum Cluster Size: 2 products
Distance Metric: Euclidean distance between product centers
- Process Steps:
Center Extraction: Calculate (x, y) coordinates for each detected product
DBSCAN Application: Group spatially proximate products
Cluster Analysis: Identify dominant product types, bounding boxes, and spatial characteristics
- Cluster Structure Analysis:
Each identified cluster contains comprehensive metadata including cluster center coordinates, product type distribution, dominant product identification, cluster size metrics, and encompassing bounding box calculations. The system performs statistical analysis to determine the most prevalent product type within each spatial grouping, enabling intelligent void attribution based on local product density patterns.
3.6. Spatial Pattern Analysis
3.6.1. Pattern Detection Framework
Following spatial clustering, the system employs advanced pattern recognition to analyze shelf organization schemes. This two-level approach combines clustering results with spatial arrangement analysis to understand the dominant organizational patterns within the retail environment.
Pattern Classification Methods:
The system analyzes product arrangements through statistical dispersion analysis, calculating horizontal and vertical spread patterns to determine the dominant spatial organization. This analysis enables the system to adapt its void attribution logic based on the detected shelf layout characteristics.
Arrangement Types:
Horizontal Patterns: Products arranged primarily in horizontal lines across shelf levels - Characteristic: High horizontal spread, low vertical dispersion - Typical in: Traditional shelf layouts, eye-level product displays - Attribution Logic: Prioritizes horizontal alignment for void assignment
Vertical Patterns: Products organized in vertical columns or stacks - Characteristic: High vertical spread, low horizontal dispersion - Typical in: Refrigerated sections, stacked product displays - Attribution Logic: Emphasizes vertical alignment relationships
Mixed Patterns: Complex arrangements with similar horizontal and vertical dispersion - Characteristic: Balanced spread in both dimensions - Typical in: End-cap displays, promotional arrangements - Attribution Logic: Applies multi-factor weighted scoring
Pattern Integration with Clustering:
The pattern analysis results directly influence the spatial clustering interpretation, providing context-aware cluster formation and enabling adaptive threshold adjustments based on detected arrangement patterns. This integration ensures that the clustering algorithm respects the underlying organizational logic of the retail display.
Spatial Context Enhancement:
The pattern analysis enhances spatial context detection by providing arrangement-specific neighbor identification algorithms. For horizontal patterns, the system prioritizes left-right neighbor relationships, while vertical patterns emphasize top-bottom spatial connections. Mixed patterns utilize comprehensive neighborhood analysis incorporating all directional relationships.
3.7. Void Attribution System
3.7.1. Pattern-Based Attribution
The void attribution system employs a three-stage intelligent assignment process:
- Stage 1: Pattern Detection
Identify spatial arrangements (horizontal, vertical, mixed)
Calculate gap distances and orientations
Detect product alignment patterns
- Stage 2: Cluster Formation
Group similar products in spatial proximity
Calculate cluster centroids and boundaries
Assign cluster dominance scores
- Stage 3: Attribution Calculation
Multi-factor scoring based on: - Distance to cluster center - Product type proportion within cluster - Spatial context strength
Advanced Spatial Context Integration:
The system implements sophisticated neighbor analysis algorithms that identify direct spatial relationships between products and voids. This includes comprehensive left, right, top, and bottom neighbor detection with alignment tolerance parameters to accommodate real-world shelf imperfections.
Context Hierarchy System:
Strong Horizontal Context: Same product type flanking void horizontally (Confidence: 1.0)
Strong Vertical Context: Same product type above and below void (Confidence: 0.9)
Moderate Context: Single-side product relationships (Confidence: 0.6)
Multi-factor Context: Complex spatial relationship scoring (Variable confidence)
Cluster Coherence Scoring:
The system calculates cluster coherence scores by analyzing the distance between voids and cluster centers, weighted by the proportion of candidate product types within each cluster. This approach ensures that void attribution considers both spatial proximity and local product density patterns.
Pattern Alignment Integration:
Pattern alignment scores adapt based on detected spatial arrangements, providing bonus scoring for voids that align with the dominant organizational pattern. Horizontal patterns receive alignment bonuses for same-row positioning, while vertical patterns prioritize column-based relationships.
3.8. Multi-Factor Scoring System
The system employs five weighted factors for comprehensive shelf analysis:
3.8.1. Scoring Factors
Spatial Context (50%) - Detection and analysis of product spatial environment - Primary factor for decision making
Proximity (25%) - Distance between detected product and target location - Inverse relationship with distance
Rarity (15%) - Priority given to less frequent products in the shelf section - Promotes inventory diversity
Pattern Alignment (10%) - Adherence to horizontal shelf organization patterns - Maintains visual merchandising standards
Detection Confidence (5%) - Reliability of combined YOLO and CNN models - Quality assurance factor
3.9. Inventory Estimation Module
The system provides comprehensive inventory analysis through multiple calculation methods:
3.9.1. Direct Counting
Method: YOLO-detected product enumeration
Grouping: CNN classification-based categorization
Validation: Cross-reference between detection models
Output: Exact counts per sub-category
3.9.2. Void-Based Estimation
Calculation: Missing product estimation through spatial assignment
Methodology: Void dimensions analysis with density factors
Projection: Theoretical capacity calculation
Integration: Combined with direct counts for total inventory
3.9.3. Volumetric Analysis
Surface Calculation: Occupied vs. available space ratio
Fill Rate: Percentage-based shelf utilization metrics
Capacity Estimation: Optimal product placement analysis
Category Sizing: Average product dimensions per category
3.9.4. Stock Metrics
The system calculates key inventory indicators:
# Core Metrics Formulas
Total_Count = Detected_Products + Void_Estimation
Fill_Rate = (Occupied_Surface / Total_Surface) × 100
Remaining_Capacity = Void_Estimation × Average_Density
3.10. Visualization and Analysis Features
3.10.1. Advanced Visualization System
The system generates comprehensive visual analytics including spatial connection mapping with dotted green lines indicating neighbor relationships, symbolic attribution indicators for different confidence levels, and cluster boundary visualization with dominant product type identification.
- Attribution Symbol System:
🎯 Strong spatial context attribution
📍 Moderate spatial context attribution
🧠 Intelligent multi-factor scoring
⚠️ Fallback attribution method
- Interactive Analysis Tools:
Real-time spatial relationship visualization
Dynamic cluster boundary adjustments
Pattern overlay displays for arrangement analysis
Confidence heat mapping for attribution decisions
3.10.2. Complete Pipeline Output Examples
The following examples demonstrate the complete pipeline output, showcasing product detection, void identification, spatial context analysis, and intelligent void attribution in real retail environments:
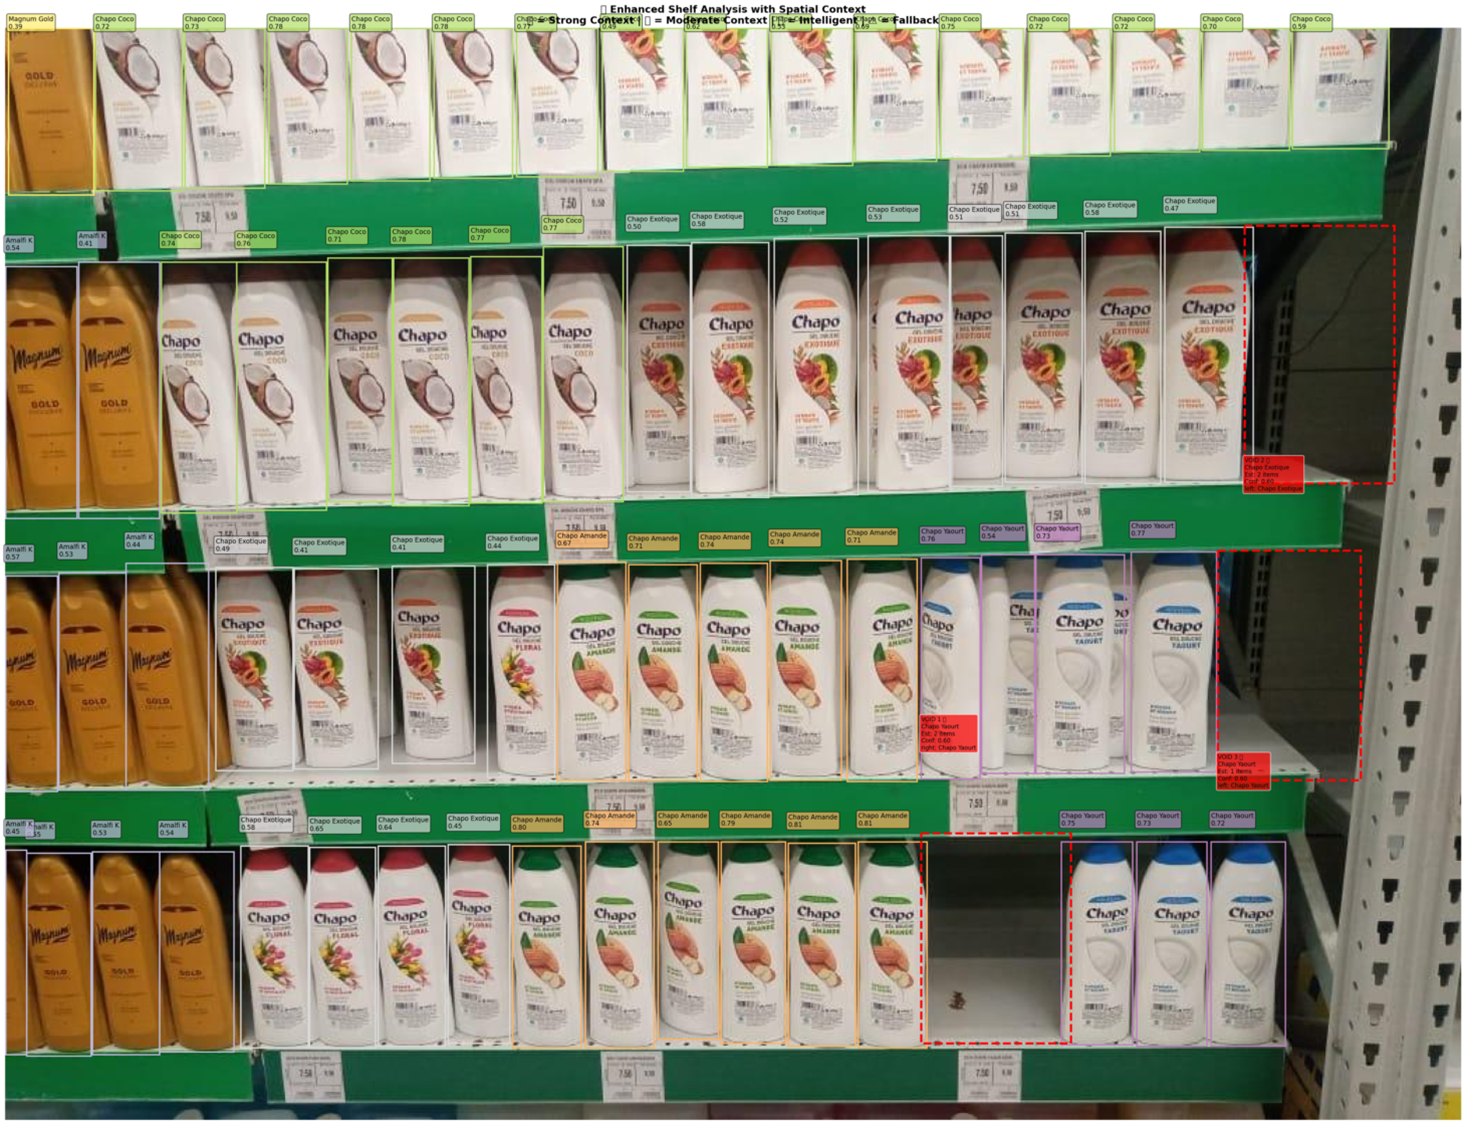
Figure: Example 1 - Enhanced shelf analysis showing product detection, void identification, and spatial context attribution for retail shelf monitoring
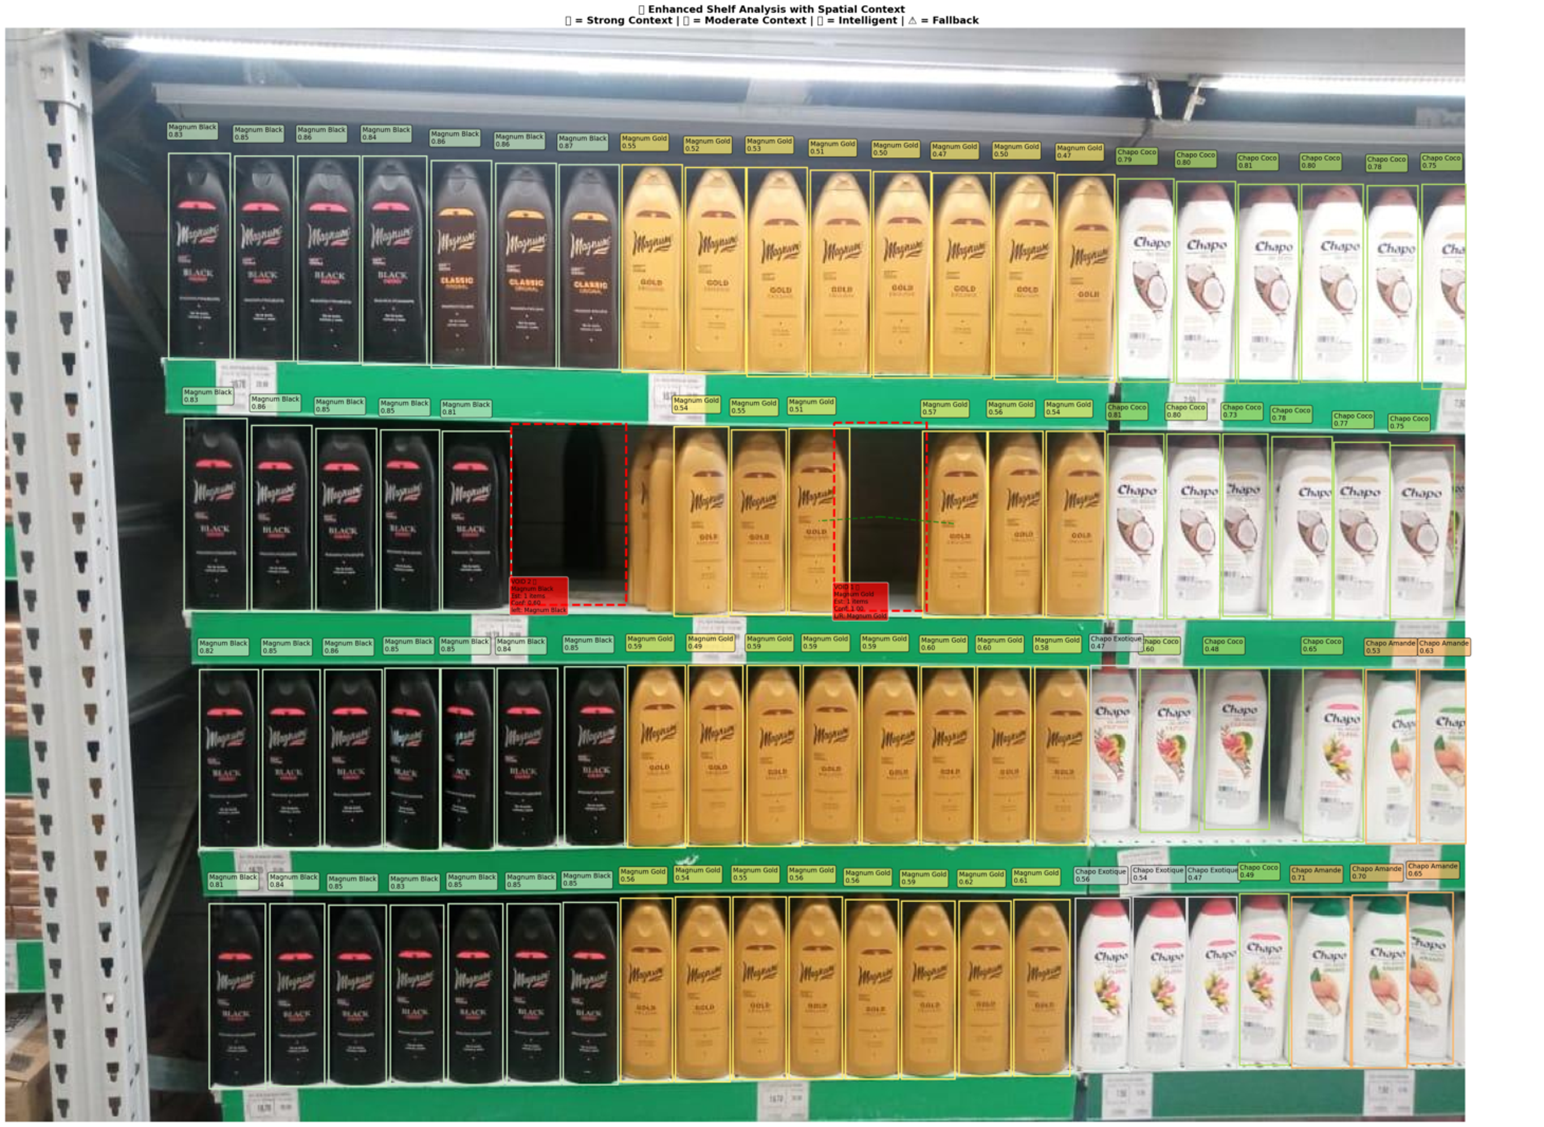
Figure: Example 2 - Complete pipeline visualization demonstrating void detection with spatial relationships and product classification across multiple shelf levels
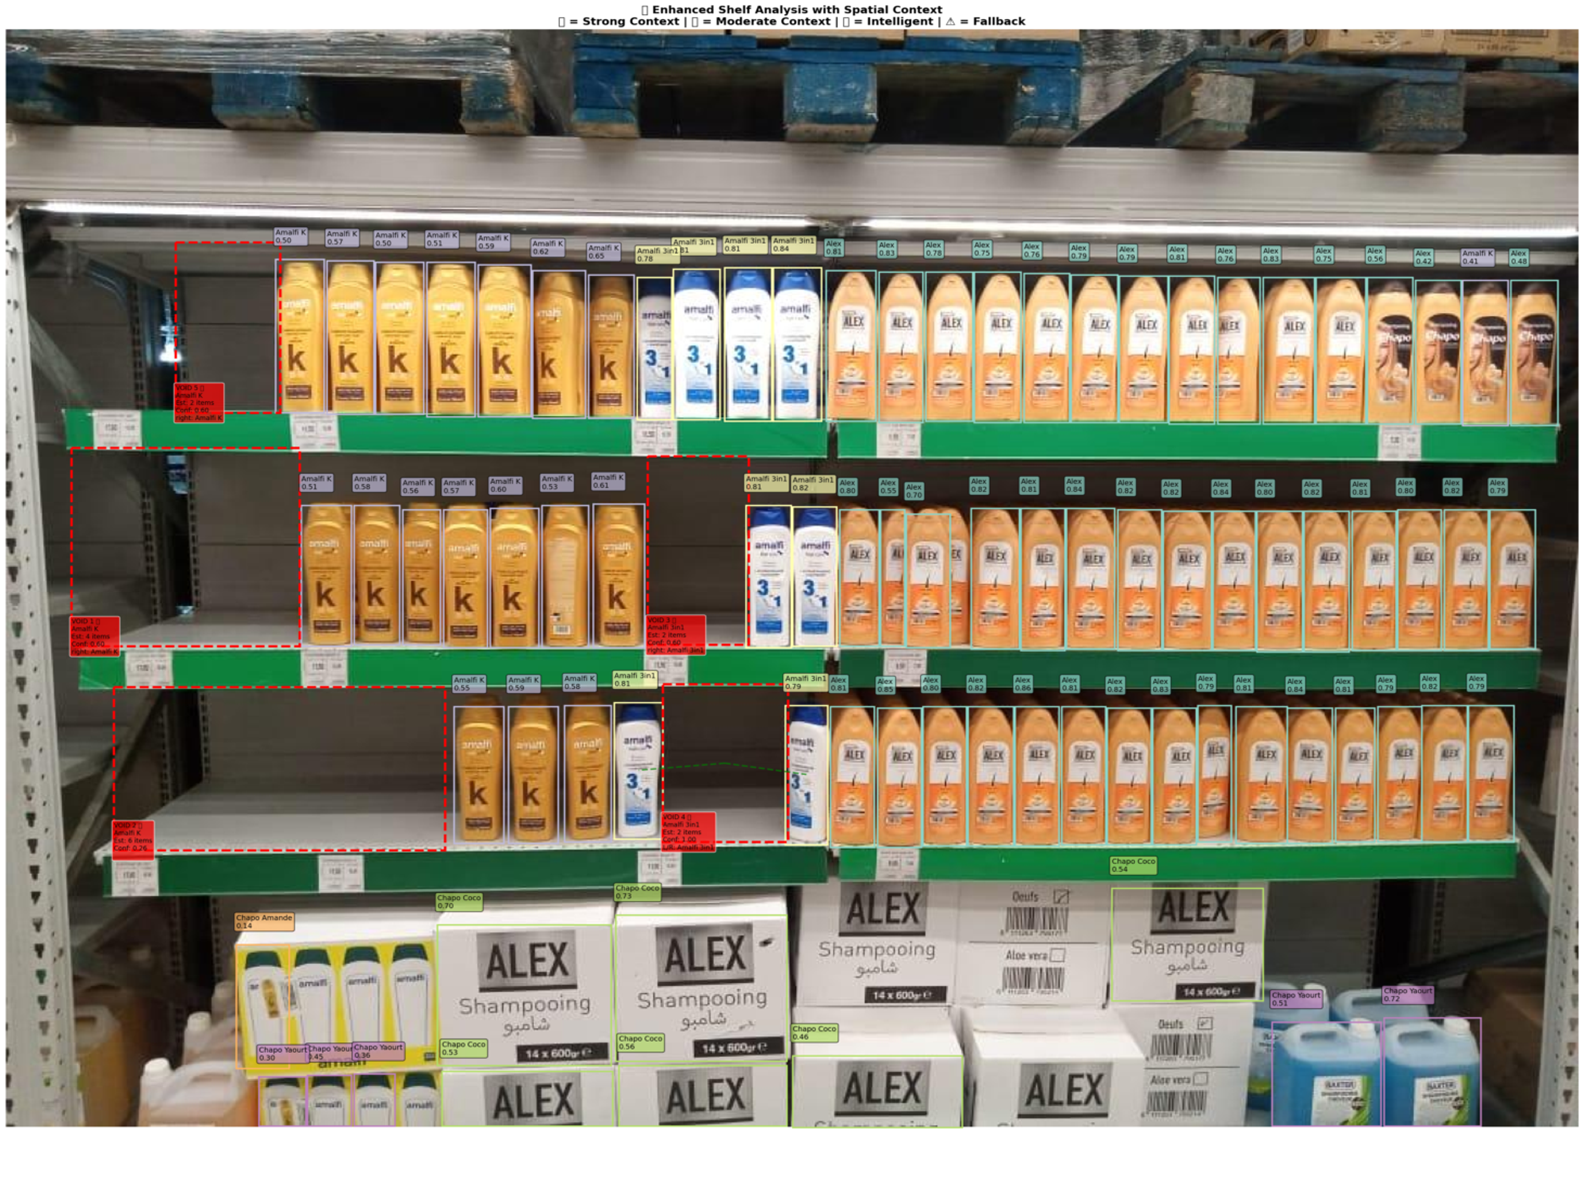
Figure: Example 3 - Comprehensive shelf analysis output featuring multiple product types, void detection, and intelligent spatial context analysis
3.11. Performance Specifications
3.11.1. Model Performance
YOLO Detection Accuracy: >95% for standard retail products
CNN Classification Accuracy: >92% for sub-category identification
Spatial Context Detection: >88% accuracy for pattern recognition
Processing Speed: <2 seconds per standard retail shelf image
Void Attribution Accuracy: >85% for intelligent assignment
Pattern Recognition Accuracy: >90% for arrangement classification
3.12. Configuration Parameters
3.12.1. Key System Parameters
The system utilizes carefully tuned parameters for optimal performance:
Clustering EPS: 80 pixels (maximum distance for cluster membership)
Minimum Cluster Size: 2 products (threshold for cluster formation)
Spatial Context Threshold: 100 pixels (maximum distance for neighbor detection)
Neighbor Alignment Tolerance: 50 pixels (alignment flexibility for imperfect shelves)
Weight Distribution: Spatial context (50%), Proximity (25%), Rarity (15%), Pattern (10%), Confidence (5%)
3.13. Future Enhancements
3.13.1. Planned Features
Multi-angle Analysis: Support for multiple camera viewpoints
Temporal Tracking: Historical trend analysis and prediction
Mobile Integration: Smartphone app for field inventory management
Advanced Analytics: Machine learning insights for inventory optimization
Enhanced Pattern Recognition: Deep learning-based arrangement classification
Dynamic Parameter Adjustment: Adaptive parameter tuning based on shelf characteristics
3.13.2. Research Directions
3D Spatial Analysis: Depth-aware inventory assessment
Dynamic Pricing Integration: Real-time price optimization based on inventory levels
Customer Behavior Analysis: Correlation between product placement and sales performance
Predictive Maintenance: Anticipate shelf restocking needs through pattern analysis
Advanced Clustering Algorithms: Exploration of alternative clustering methods for complex arrangements
Contextual Learning: Machine learning approaches for automatic spatial context understanding